The DPRA Heat stress report includes reference information on the city of Wageningen on 02-08-2013. It is deemed relevant to the report because it can be related to actual measurements made for the city of Wageningen. The PET measurements for this exceptionally hot day are comparable to the default 01-07-2015 reference case for Wageningen.
The performed benchmark has an average difference below 0.68% for the selected measurement points.
Results
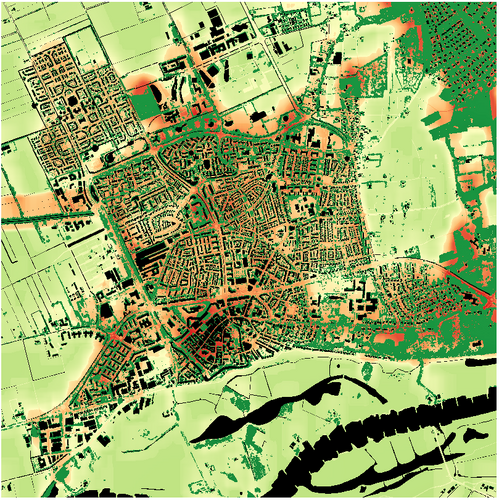
The PET Benchmark result overlays can be seen below:
PET daytime map for August 2, 2013 12 UTC with the weather data from the reference station Herwijnen as calculated by the Tygron Platform
Point Measurement Analysis
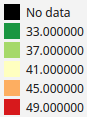
Several points have been compared for results. These points across the map have been selected based on fact that their spatial situation (i.e. input data like foliage and vegetation fraction) is similar for both the Wageningen calculated PET and Tygron generated PET.
Location of the measurement points in blue.
id
Wageningen PET
Tygron PET
Difference (%)
01
46.12
46.13
0.022
02
47.44
48.04
1.26
03
47.11
47.52
0.87
04
44.70
44.99
0.65
05
40.53
40.48
-0.12
06
38.69
38.67
-0.05
07
42.52
42.45
-0.16
08
44.87
44.03
-1.87
09
43.62
43.02
-1.38
10
46.79
46.58
-0.45
11
38.70
38.79
0.23
12
44.40
44.00
-0.90
13
46.34
46.29
-0.11
14
45.58
45.77
0.42
15
39.05
39.42
0.95
16
38.22
38.28
0.16
17
43.23
43.88
1.50
18
46.34
46.49
0.32
19
45.59
44.84
-1.65
20
46.21
45.96
-0.54
Average
0.68
So on average for points that in both cases have a similar spatial situation the difference in calculated PET is 0.68%.
Setup
Weather data from weatherstation Herwijnen has been used for this test case. The used values are:
Variable
Value
Date
02-08-2013
Hour of day
14
Sun altitude
55.5
Sun azimuth
186.9
Sun daily motion factor
0.063
Humidity (%)
56
Sun radiation (W/m2)
774
Temperature (°C)
31.7
Wind speed (m/s)
4
Wind direction (°)
140
Daily min. temperature (°C)
18.9
Daily max. temperature (°C)
34.1
Daily avg. radiation (W/m2)
455
Daily avg. wind speed
3.17
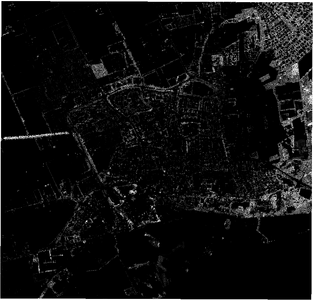
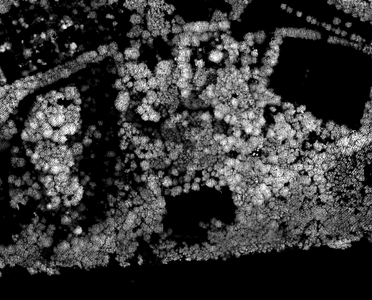
The foliage height will be defined by a GeoTIFF. See the images (overview and zoomed in east-south-east corner) below:
Overview of the foliage height in Wageningen
Zoomed in on the foliage height in Wageningen, east-south-east corner of the overview
Calculation time
The calculation time of the PET overlay of 1 timeframe on a 1x1 meter grid for a 4x4km area of Wageningen is approximately 5 seconds.


